Yes or No Questions Data Collection Activities
Statistics and Probability
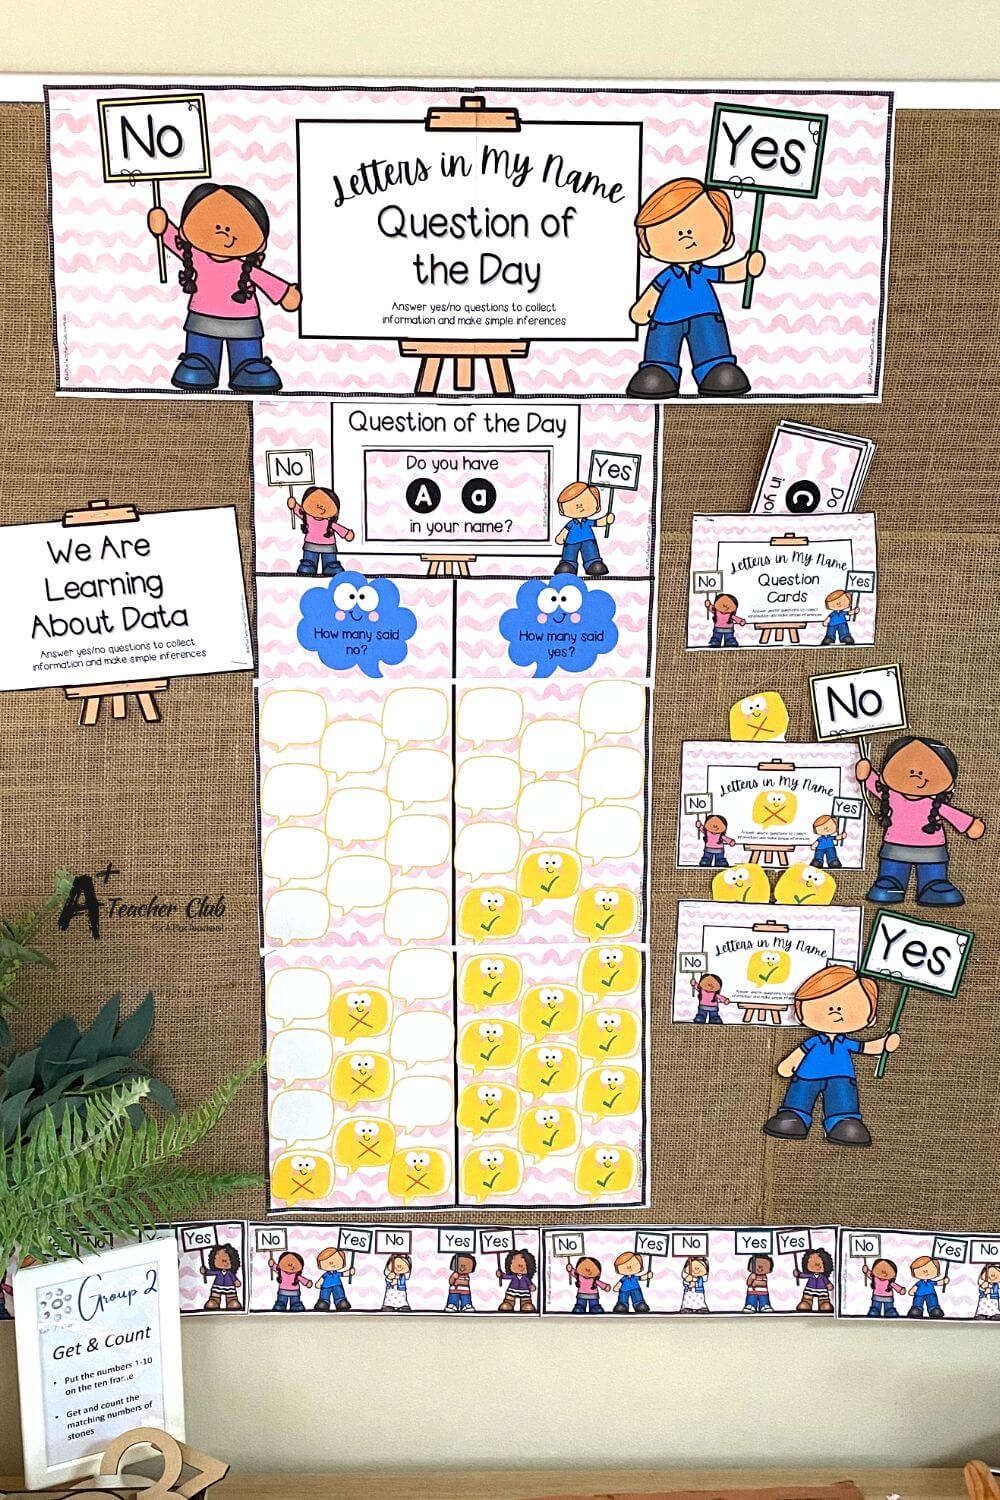
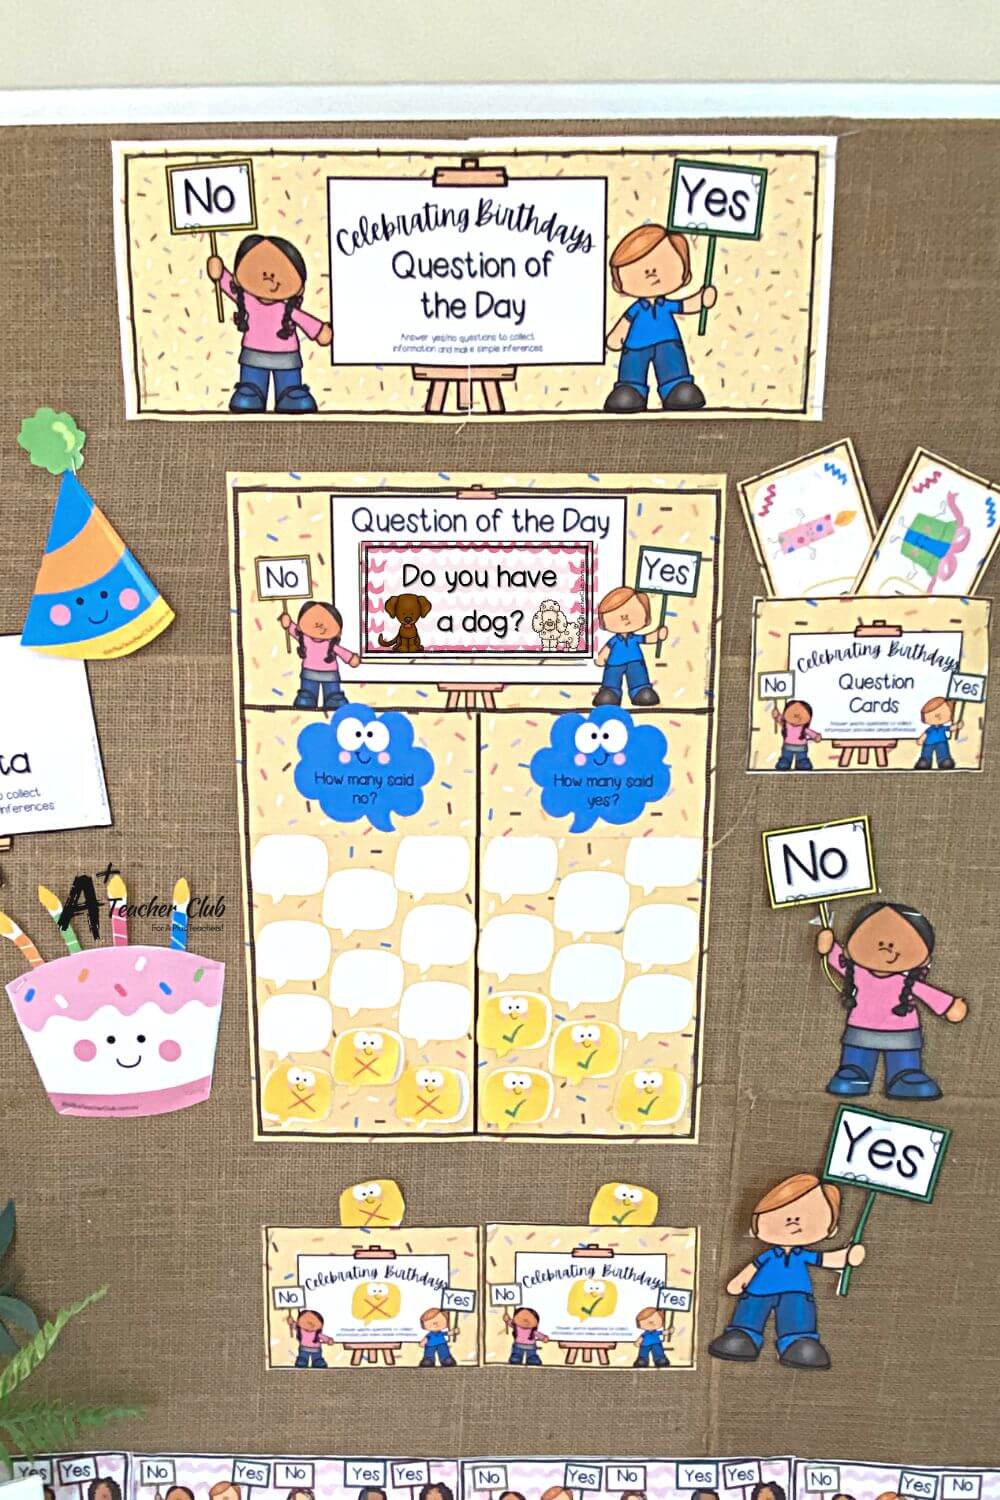
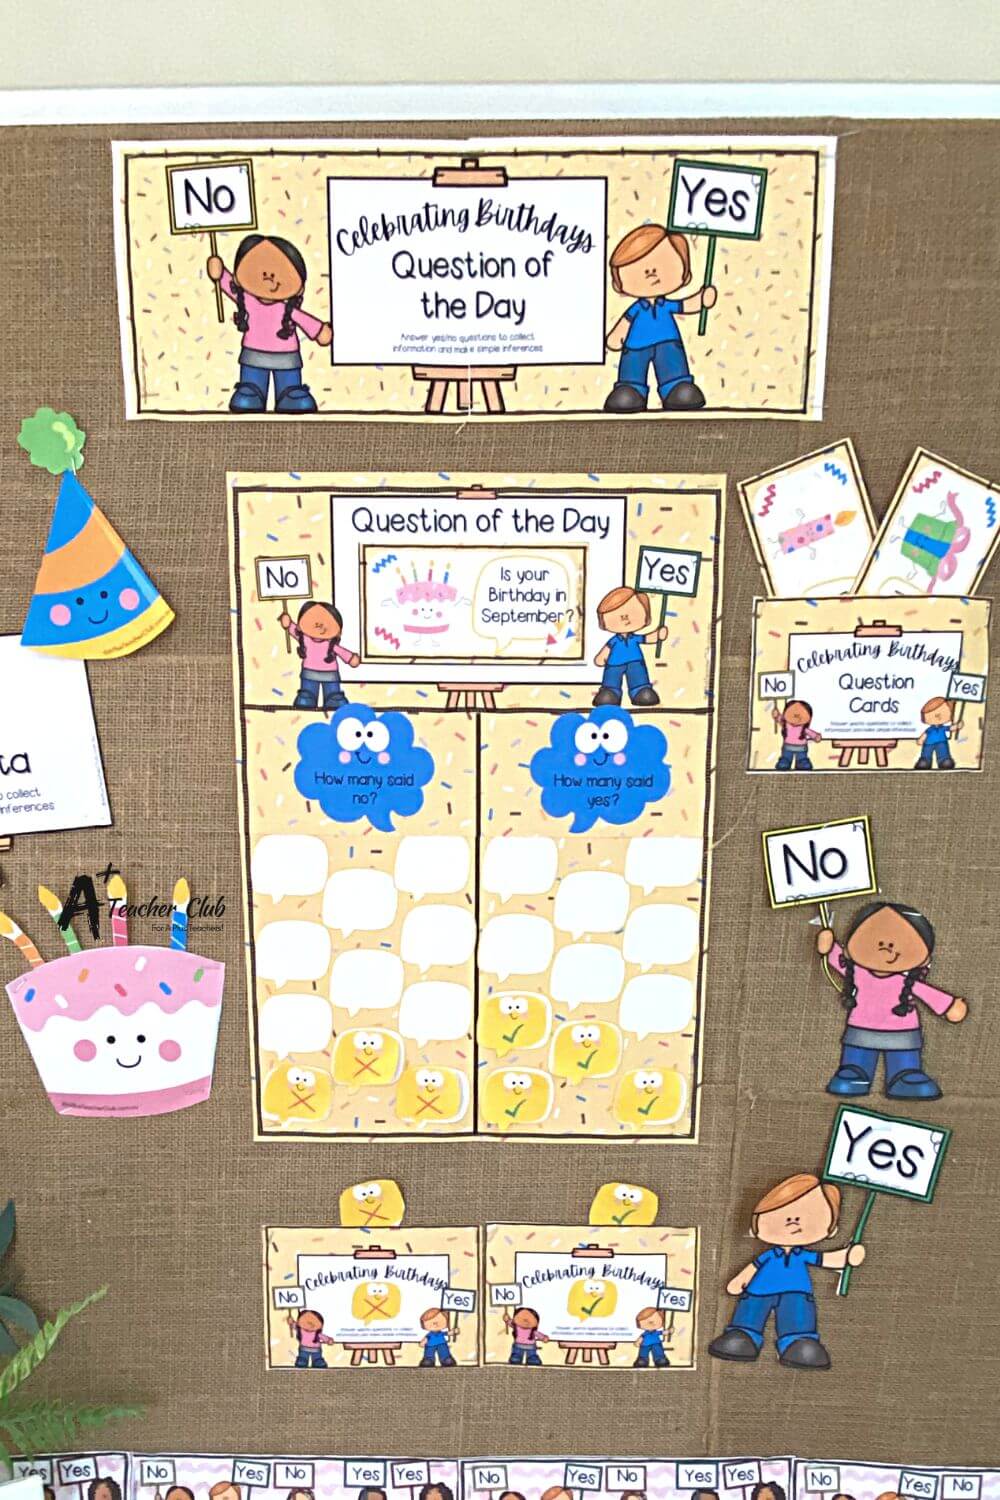
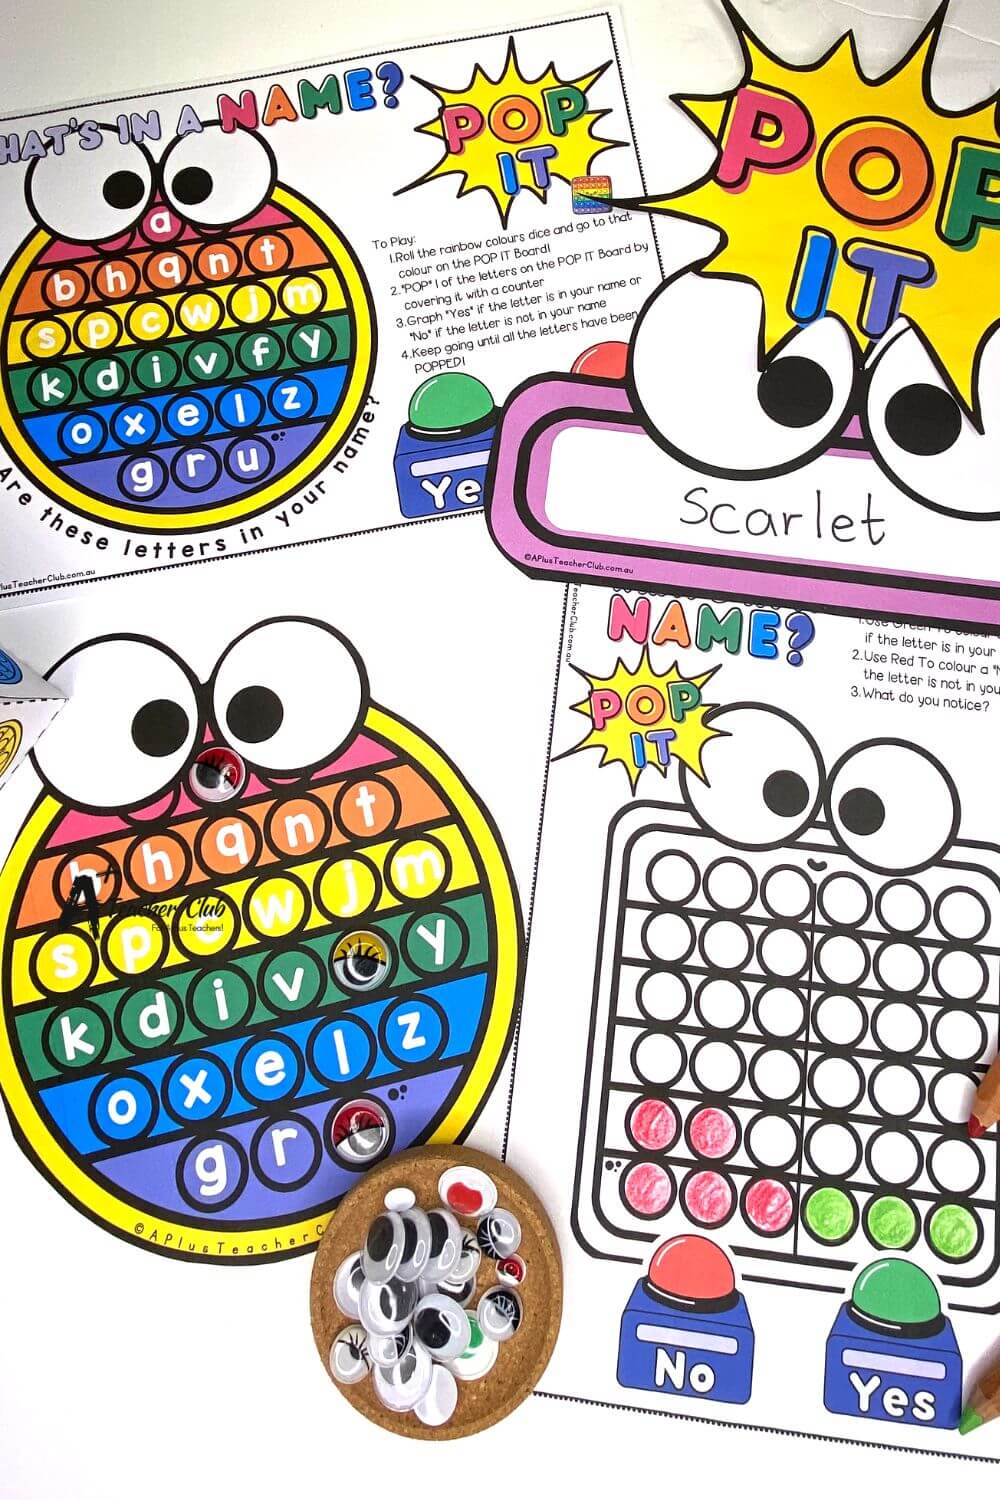
These yes or no questions data collection activities are perfect for introducing early years students to chance and data concepts. There’s a differentiated range of ask-and-collect student sheets and a stack of yes or no question packs to keep you going throughout the year!
Introduction to Collecting Data
Collecting data is an essential skill for students to learn, as it helps them understand the world around them and make informed decisions. Data collection involves gathering information about a particular topic or phenomenon, and it can be done in various ways, such as through surveys, observations, or experiments. By teaching students how to collect data, we enable them to explore data, analyze data, and draw meaningful conclusions. Whether it’s through a simple classroom survey or a more structured experiment, collecting data helps students develop critical thinking and problem-solving skills.
Statistics and Probability
These yes or no questions data collection activities are perfect for introducing early years students to chance and data concepts. Engaging in these data activities helps students understand the fundamentals of data collection and interpretation through hands-on exercises like sorting items, constructing graphs, and interpreting findings. There’s a differentiated range of ask-and-collect student sheets and a stack of yes or no question packs to keep you going throughout the year!
Effective Data Collection Strategies
Effective data collection strategies are crucial for obtaining accurate and reliable data. Here are some strategies that can be used in the classroom:
- Surveys: Surveys are a great way to collect data from a large group of people. They can be conducted online or in-person, and can be used to gather information about opinions, behaviours, or demographics. This method is particularly useful for teaching students how to collect responses and analyze data sets.
- Observations: Observations involve collecting data by watching and recording behaviour or events. This method is useful for studying phenomena that cannot be measured or quantified. It helps students understand the importance of recording data accurately and consistently.
- Experiments: Experiments involve manipulating variables to test hypotheses and collect data. This method is useful for studying cause-and-effect relationships. By conducting experiments, students learn how to gather data systematically and analyze the results.
- Tally marks: Tally marks are a simple way to collect data by counting and recording responses. This method is particularly useful for younger students who are just starting to learn about data collection. It provides a hands-on, visual way to gather data and can be easily incorporated into fun activities.
Presenting Data
Once data has been collected, it needs to be presented in a way that is easy to understand and interpret. Here are some ways to present data:
- Picture graphs: Picture graphs are a great way to present data to younger students. They use pictures or icons to represent data, making it easy to understand and interpret. This method is particularly engaging for younger students and helps them visualize the data.
- Bar graphs: Bar graphs are a popular way to present data, as they use bars to represent different categories and values. They are effective for comparing data and can be used to display data collected from various activities.
- Tables: Tables are a great way to present data in a clear and organized manner. They can be used to display data in rows and columns, making it easy to compare and contrast different values. Tables are particularly useful for summarizing data sets and presenting data in a structured format.
- Data displays: Data displays are a great way to present data in a visually appealing way. They can be used to display data in a variety of formats, such as charts, graphs, and tables. By using different types of data displays, students can learn how to present data effectively and make their findings more accessible to others.
Teaching Data Collection in The Early Years
So What Does Teaching Chance & Data Look Like in The Early Years?
In the early years teaching kids about data should focus on:
- Asking and answering yes/no questions to collect information
- Collecting & Displaying Data from Yes or No questions
- Interpret and answer simple questions about the data display
This means students should be able to collect information about themselves or others by asking questions that require a yes or no answer.
Yes /No questions at the Foundation, Prep and Kindergarten year range need to be relatable to the students, for example:
“Do you have brown eyes?” “Do you have a pet?” or “Can you tie your shoelace?”
are all questions children in the early years would be familiar with.
Students at this stage are then expected to be able to show or represent the answers to the questions in a simple display like a list, a group or a picture graph; which they then need to be able to interpret by answering simple questions.
A simple way to cover all these teaching points is with “Question of the Day” activities where students answer a simple question with “Yes or No” and place their answer on a class display. The results can then be discussed during mat time later in the day. To extend this further and encourage higher-order thinking students can ask and tally their own yes or no questions in quick investigations.
Resources listed in this collection
Click to jump to...Yes or No Questions Teaching Resources
Explore tags
More Statistics & Probability Resources
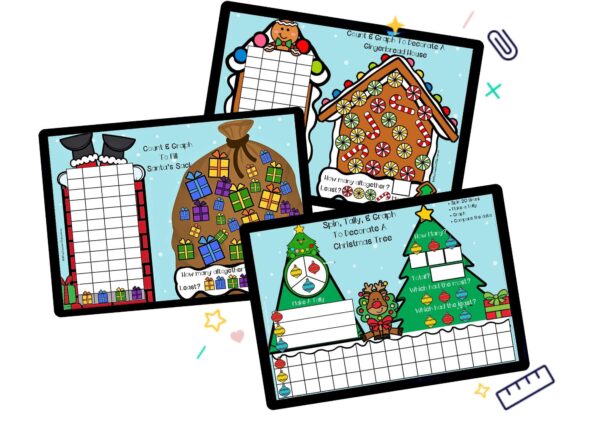
Christmas Maths - Data & Graphing
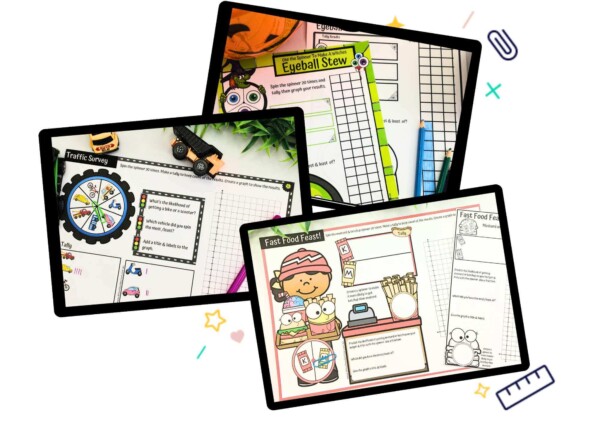
Data & Graphs - Data Investigations
Statistics & Probability - Chance & Data
Can't find what you're looking for?
Send us a request! Use this form to request a resource. Please give details of the learning area, topic, year level, curriculum links. We’ll be happy to take a look to see if we can fit it in. Unfortunately a request does not guarantee we will be able to make it!
"*" indicates required fields

