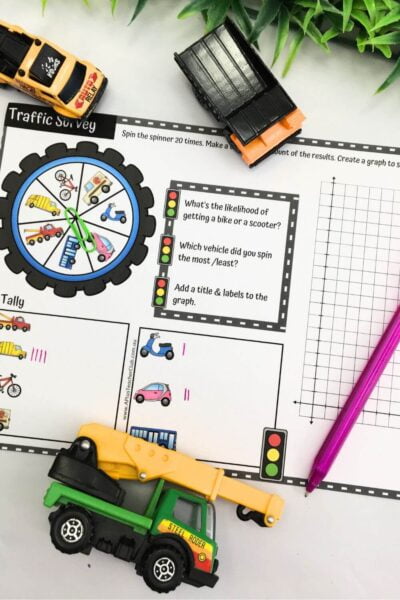
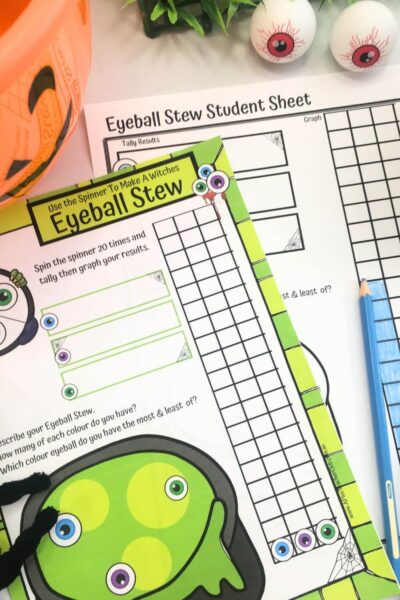
Data Collection Activities
Data & Graphs
Are you searching for data collection activities that will captivate and engage your students? Teaching data collection can indeed be challenging, but with the right approach, it can transform into an exciting and meaningful learning journey.
In this blog post, we will delve into the essentials of data collection, offer strategies for effective teaching, and address common challenges students may encounter. Additionally, we’ll share a variety of engaging activities designed to help your students develop their data collection and graphing skills. These activities will introduce students to essential skills in data handling and interpretation. Get ready to make learning about data collection a fun and dynamic experience!
Introduction to Data Collection
Data collection is an essential skill for students to develop, as it enables them to gather information, analyze it, and make informed decisions. Collecting data can be a fun and engaging activity for students, and it can be done in various ways, such as through surveys, observations, and experiments.
By teaching students how to collect data, we can help them develop critical thinking skills, problem-solving skills, and analytical skills. In this section, we will explore the importance of data collection and provide tips on how to introduce it to students.
Teaching Data Collection & Graphing
Teaching data collection and graphing involves guiding students in gathering, recording, organizing, and visually representing information. Students need to learn how to design surveys or experiments, accurately record data, and use various types of graphs such as bar graphs, line graphs, and pie charts to display their findings.
Students also need to understand how to interpret these graphs, identify patterns, and draw conclusions from the data. These skills are essential for developing critical thinking and analytical abilities, which are foundational for success in both academic and real-world contexts.
Data Collection Methods
There are several data collection methods that students can use, depending on the type of data they want to collect. Some common methods include:
- Surveys: Students can create surveys to collect data from their peers, family members, or community members.
- Observations: Students can observe events in their environment, such as the types of birds that visit a bird feeder or the types of cars in the staff car park
- Experiments: Students can design and conduct experiments to collect data on a specific topic, such as the effect of light on plant growth.
- Online data sources: Students can use online data sources, such as government databases or scientific websites, to collect data on a specific topic.
By teaching students different data collection methods, we can help them develop a range of skills, including critical thinking, problem-solving, and analytical skills.
Data Collection & Graphing Ideas
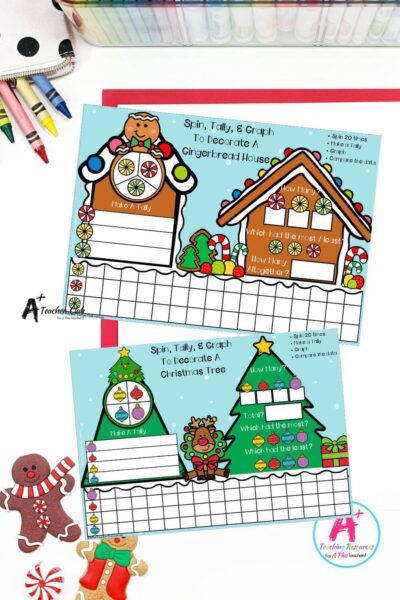
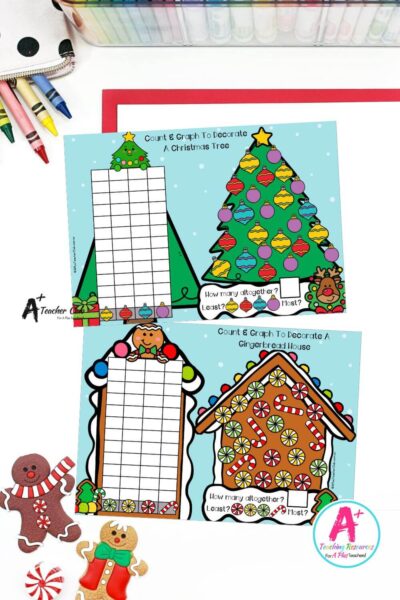
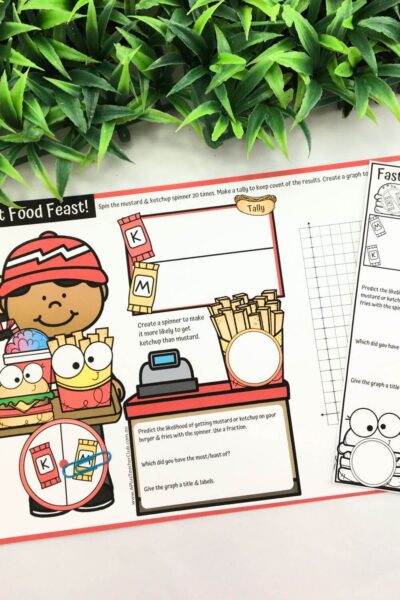
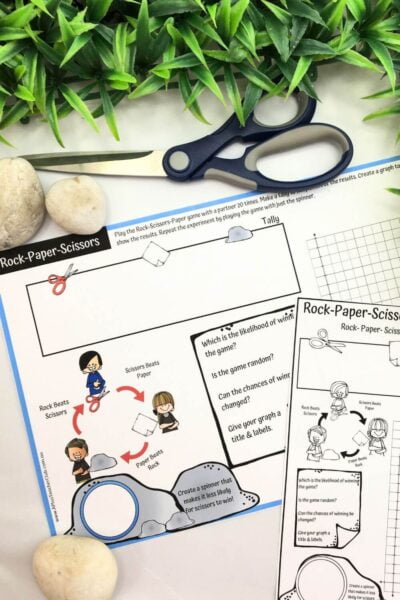
Teaching data collection and graphing can be both fun and educational with the right activities. Here are some engaging activities that will help your students develop these important skills while enjoying the process:
- Classroom Weather Chart: Record daily weather using symbols. Create bar graphs at the end of each week or month.
- Favourite Fruit Survey: Conduct a survey of favourite fruits. Tally the results and create bar graphs or pie charts.
- Nature Walk Data Collection: Collect data on various items seen during a nature walk. Create pictographs to display findings.
- Class Pets Graph: Record and graph the types and numbers of pets students have. Compare different graph types.
- Monthly Reading Log: Track the number of books read each week. Create line graphs to show reading progress.
- Snack Time Data Collection: Tally snack choices. Create bar graphs or pie charts to display preferences.
- Plant Growth Tracking: Measure and record plant growth over time. Create line graphs to track growth.
- Favourite Colour Poll: Poll the class on their favourite colours. Use the data to create bar graphs or pie charts.
- Sports Preferences Survey: Survey students on their favourite sports. Graph the results and discuss.
- Recess Activity Data: Record which activities students choose during recess. Create graphs to display popular activities.
- Birthday Graph: Create a graph showing the number of birthdays in each month. Discuss patterns and trends.
- Lunch Preferences Poll: Poll students on their favourite lunch items. Tally and graph the results.
- School Bag Weight Survey: Measure and record the weight of students’ school bags. Create graphs to compare weights.
These activities will not only make data collection and graphing enjoyable but also help students understand the practical applications of these skills, including collecting and analyzing data.
Support Students with Difficulties
Students may face several difficulties when learning about data collection and graphing, including:
- Accurate Data Collection: Struggling with how to organize and record data accurately.
- Interpreting Graphs: Finding it challenging to extract meaningful information from visual representations.
- Creating Graphs: Difficulty in creating graphs that correctly reflect the collected data and choosing the appropriate graph types.
- Understanding Concepts: Challenges with scale, proportion, and data comparison.
- Organization and Attention: Issues with maintaining organization and attention to detail during data collection and graphing tasks.
Addressing these difficulties with targeted support and practice will help students build the confidence and skills needed to effectively collect and analyze data, turning these challenges into valuable learning opportunities. Check out our collection of activities below…
Resources listed in this collection
Click to jump to...Data Collection Investigations
Explore tags
More Statistics & Probability Activities
Statistics & Probability - Chance & Data
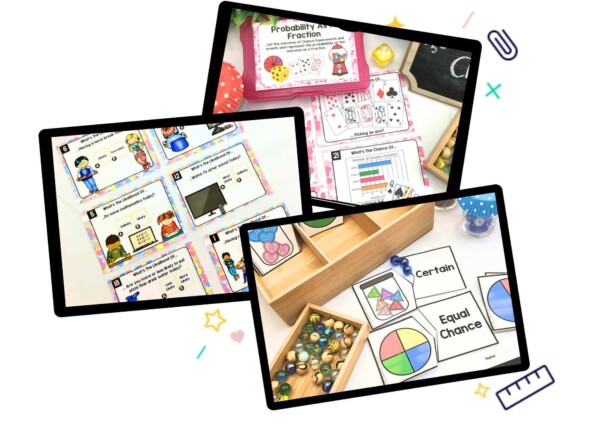
Statistics & Probability - Probability Activities
Can't find what you're looking for?
Send us a request! Use this form to request a resource. Please give details of the learning area, topic, year level, curriculum links. We’ll be happy to take a look to see if we can fit it in. Unfortunately a request does not guarantee we will be able to make it!
"*" indicates required fields

